前言
回归分析就是用于预测输入变量(自变量)和输出变量(因变量)之间的关系,特别当输入的值发生变化时,输出变量值也发生改变!回归简单来说就是对数据进行拟合。线性回归就是通过线性的函数对数据进行拟合。机器学习并不能实现预言,只能实现简单的预测。我们这次对房价关于其他因素的关系。
波士顿房价预测
下载相关数据集
- 数据集是506行14列的波士顿房价数据集,数据集是开源的。
wget.download(url='https://archive.ics.uci.edu/ml/machine-learning-databases/housing/housing.data',out= 'housing.data')
wget.download(url='https://archive.ics.uci.edu/ml/machine-learning-databases/housing/housing.names',out='housing.names')
wget.download(url='https://archive.ics.uci.edu/ml/machine-learning-databases/housing/Index',out='Index')
对数据集进行处理
feature_names = ['CRIM','ZN','INDUS','CHAS','NOX','RM','AGE','DIS','RAD','TAX','PTRATIO','B','LSTAT','MEDV']
feature_num = len(feature_names)
print(feature_num)

# 把7084 变为506*14
housing_data = housing_data.reshape(housing_data.shape[0]//feature_num,feature_num)
print(housing_data.shape[0])
# 打印第一行数据
print(housing_data[:1])


## 归一化

feature_max = housing_data.max(axis=0)
feature_min = housing_data.min(axis=0)
feature_avg = housing_data.sum(axis=0)/housing_data.shape[0]
模型定义
## 实例化模型
def Model():
    model = linear_model.LinearRegression()
    return model

# 拟合模型
def train(model,x,y):
    model.fit(x,y)
可视化模型效果
def draw_infer_result(groud_truths,infer_results):
    title = 'Boston'
    plt.title(title,fontsize=24)
    x = np.arange(1,40)
    y = x
    plt.plot(x,y)
    plt.xlabel('groud_truth')
    plt.ylabel('infer_results')
    plt.scatter(groud_truths,infer_results,edgecolors='green',label='training cost')
    plt.grid()
    plt.show()
整体代码
## 基于线性回归实现房价预测
## 拟合函数模型
## 梯度下降方法

## 开源房价策略数据集

import wget
import numpy as np
import os
import matplotlib
import matplotlib.pyplot as plt

import pandas as pd

from sklearn import  linear_model


## 下载之后注释掉
'''
wget.download(url='https://archive.ics.uci.edu/ml/machine-learning-databases/housing/housing.data',out= 'housing.data')
wget.download(url='https://archive.ics.uci.edu/ml/machine-learning-databases/housing/housing.names',out='housing.names')
wget.download(url='https://archive.ics.uci.edu/ml/machine-learning-databases/housing/Index',out='Index')
'''
'''
    1. CRIM      per capita crime rate by town
    2. ZN        proportion of residential land zoned for lots over
                 25,000 sq.ft.
    3. INDUS     proportion of non-retail business acres per town
    4. CHAS      Charles River dummy variable (= 1 if tract bounds
                 river; 0 otherwise)
    5. NOX       nitric oxides concentration (parts per 10 million)
    6. RM        average number of rooms per dwelling
    7. AGE       proportion of owner-occupied units built prior to 1940
    8. DIS       weighted distances to five Boston employment centres
    9. RAD       index of accessibility to radial highways
    10. TAX      full-value property-tax rate per $10,000
    11. PTRATIO  pupil-teacher ratio by town
    12. B        1000(Bk - 0.63)^2 where Bk is the proportion of blacks
                 by town
    13. LSTAT    % lower status of the population
    14. MEDV     Median value of owner-occupied homes in $1000's
'''
## 数据加载

datafile = './housing.data'

housing_data = np.fromfile(datafile,sep=' ')

print(housing_data.shape)


feature_names = ['CRIM','ZN','INDUS','CHAS','NOX','RM','AGE','DIS','RAD','TAX','PTRATIO','B','LSTAT','MEDV']
feature_num = len(feature_names)
print(feature_num)

# 把7084 变为506*14
housing_data = housing_data.reshape(housing_data.shape[0]//feature_num,feature_num)
print(housing_data.shape[0])
# 打印第一行数据
print(housing_data[:1])


## 归一化

feature_max = housing_data.max(axis=0)
feature_min = housing_data.min(axis=0)
feature_avg = housing_data.sum(axis=0)/housing_data.shape[0]

def feature_norm(input):
    f_size = input.shape
    output_features = np.zeros(f_size,np.float32)
    for batch_id in range(f_size[0]):
        for index in range(13):
            output_features[batch_id][index] = (input[batch_id][index]-feature_avg[index])/(feature_max[index]-feature_min[index])

    return output_features


housing_features = feature_norm(housing_data[:,:13])

housing_data = np.c_[housing_features,housing_data[:,-1]].astype(np.float32)


## 划分数据集  8:2
ratio =0.8

offset = int(housing_data.shape[0]*ratio)

train_data = housing_data[:offset]
test_data = housing_data[offset:]

print(train_data[:2])


## 模型配置
## 线性回归

## 实例化模型
def Model():
    model = linear_model.LinearRegression()
    return model

# 拟合模型
def train(model,x,y):
    model.fit(x,y)


## 模型训练

X, y = train_data[:,:13], train_data[:,-1:]

model = Model()
train(model,X,y)

x_test, y_test = test_data[:,:13], test_data[:,-1:]
prefict = model.predict(x_test)

## 模型评估

infer_results = []
groud_truths = []

def draw_infer_result(groud_truths,infer_results):
    title = 'Boston'
    plt.title(title,fontsize=24)
    x = np.arange(1,40)
    y = x
    plt.plot(x,y)
    plt.xlabel('groud_truth')
    plt.ylabel('infer_results')
    plt.scatter(groud_truths,infer_results,edgecolors='green',label='training cost')
    plt.grid()
    plt.show()


draw_infer_result(y_test,prefict)
效果展示
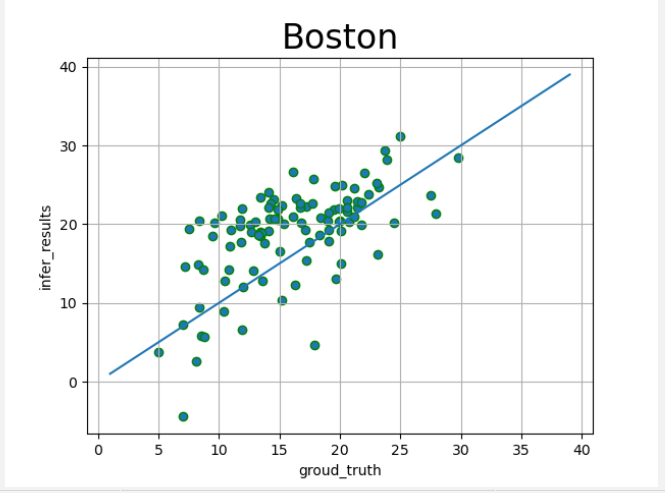

总结
线性回归预测还是比较简单的,可以简单理解为函数拟合,数据集是使用的开源的波士顿房价的数据集,算法也是打包好的包,方便我们引用。
本站文章如无特殊说明,均为本站原创,如若转载,请注明出处:【机器学习】线性回归预测 - Python技术站
 微信扫一扫
微信扫一扫  支付宝扫一扫